
The purpose of this article is to document my process of creating a SIEM system in order to get hands-on practice with two technologies I find very interesting: Suricata and Elasticsearch.
The thing I find fascinating about this kind of SIEM is that it can track security events across a system of almost any scale. In my case it's comprised of only two virtual Ubuntu machines.
This article will explore the process of creating a rule in Kibana to track alerts. I'll also create a rule to match specific Suricata events to then track and analyze in greater detail.
Prior to this, I built a Suricata and Elastic Stack SIEM system by installing and configuring Elasticsearch and Kibana on a standalone Ubuntu 20.04 server and configured both tools to be available on a private IP address. I also configured Elasticsearch and Kibana's authentication setting using the xpack security module that is included on each tool.
After configuring Elasticsearch and Kibana, I then installed Filebeat on my Suricata server, which is a separate Ubuntu 20.04 machine. Both the Elasticsearch and the Suricata servers are on the same virtual private network in the cloud. I used Filebeat to populate Kibana's dashboards and to send Suricata's logs to Elasticsearch.
After all of this I created an SSH tunnel from my local Kali machine to the Elasticsearch server and logged into Kibana:

The screen cap below is a view of the events being sent by Suricata. I'm currently logged in using the "elastic" user credentials generated by the elasticsearch-setup-passwords utility under /usr/share/elasticsearch/bin on the Elasticsearch server.

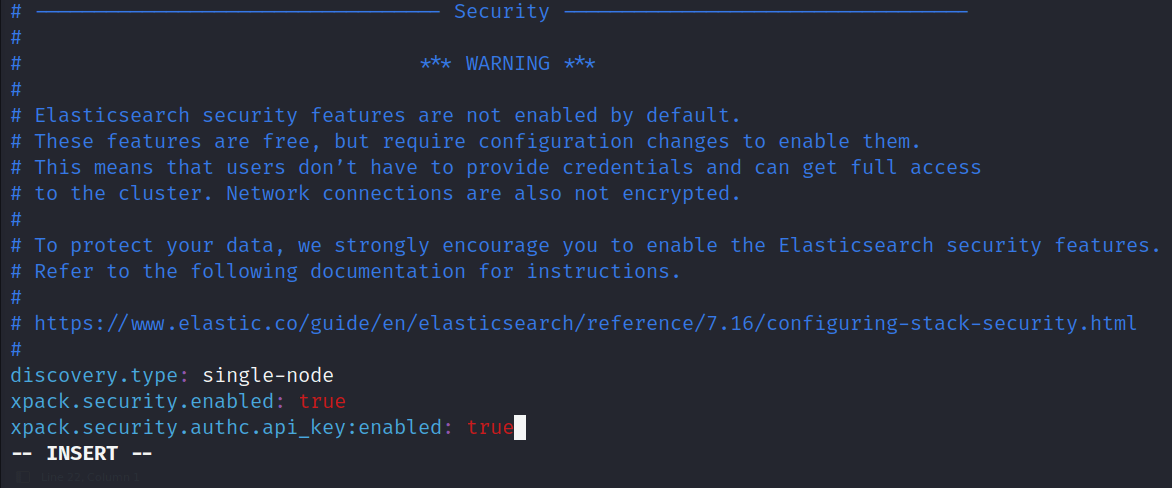
In order to create custom Kibana rules and generate alerts within Kibana’s SIEM dashboards, it is necessary to enable the API key security module setting in xpack. Opening up the elasticsearch.yml file, I add the following line: xpack.security.authc.api_key.enabled: true

Now I can add rules to kibana by navigating to the rules dashboard. I want to be able to be alerted on a fairly common alert, which is ssh traffic being used on a non-standard ssh port.

I'll be using the customer query option and then filling in the required prompts:


And I've successfully created the rule:

This is the general process of adding rules to Kibana in order to generate alerts about suspicious traffic. Going forward, my plan is to create a timeline to group set of the same alerts.